If your nonprofit uses Google Analytics to see how people are interacting with your website, you may have noticed that the platform looks a little different. As of July 1, Google Analytics 4 replaced the Universal Analytics platform that has been in place for years. We’ve created this guide to Google Analytics for nonprofits to help you get oriented to the new platform.
The change probably wasn’t a surprise. They’ve been talking about GA4 for months. However, the differences are drastic, and many nonprofits are realizing they’re not sure what to do now, especially since Google’s own guide to Google Analytics for nonprofits still refers to the old system.
We know you’re busy, so we’ll keep this as short and straightforward as we can while still giving you the details you need.
What is Google Analytics 4?
GA4 is Google’s newest platform for measuring data on your website. It launched in 2020, but as of July 2023, it became the default analytics tool offered by Google. It integrates with Google ads and other services to allow organizations to track interactions with donors and stakeholders.
If you’re familiar with Universal Analytics, the most obvious change you’ll notice is the dashboard. The user interface in GA4 is more streamlined, which might make it harder to find your most important metrics until you figure out where everything is hiding.
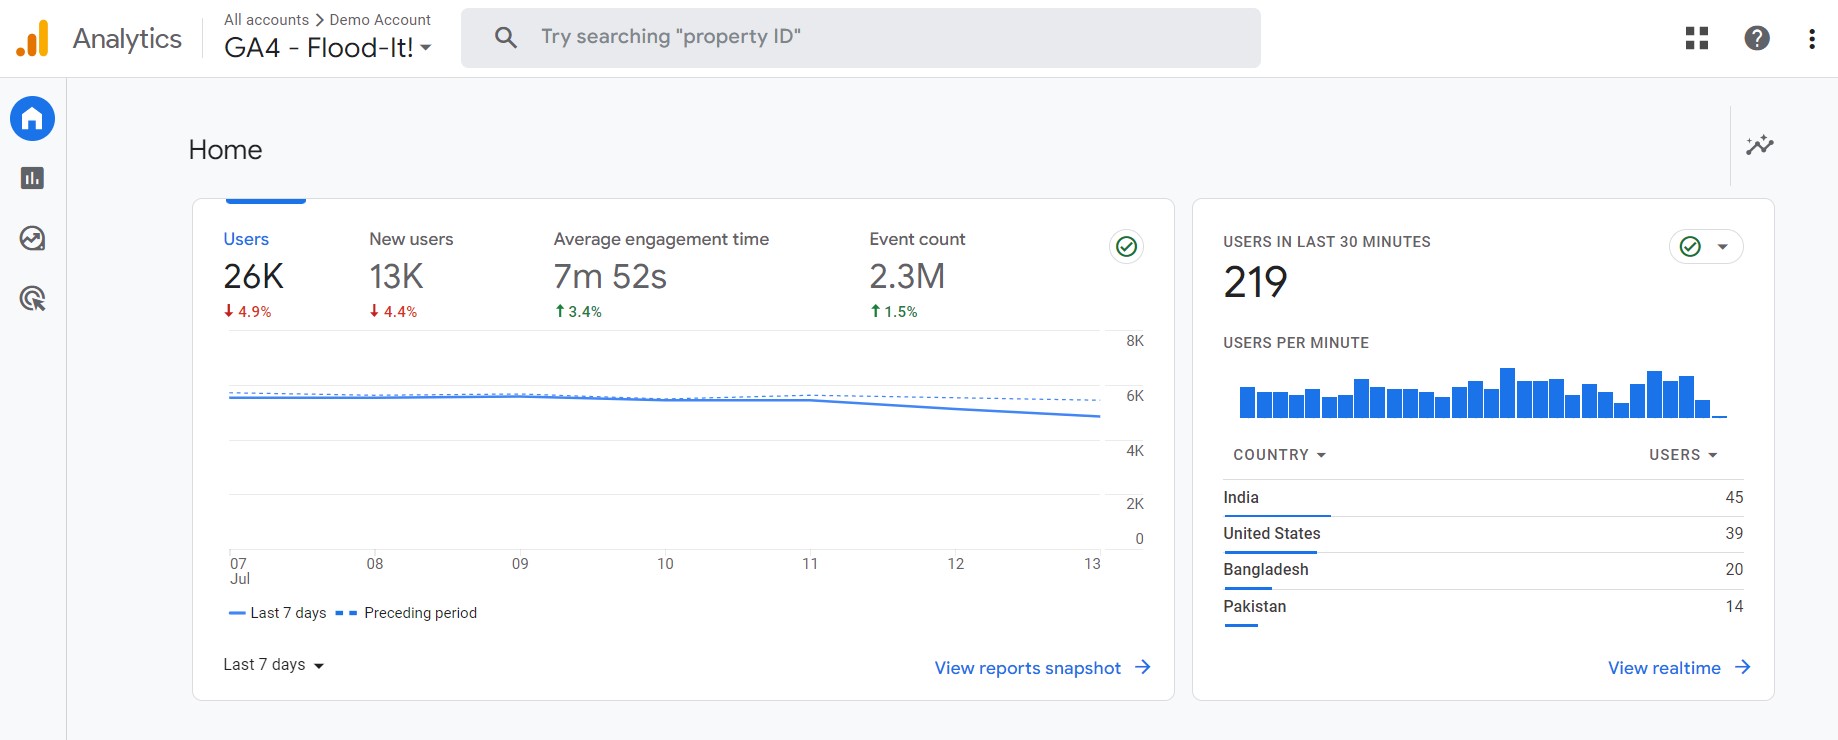
The way the data is organized is also changing. In Universal Analytics, everything was organized around page views. It was easy to see how many people visited a page. This was great for content marketing teams who wanted to know how many visitors saw their blog about the new fundraising campaign.
By contrast, GA4 is more focused on events. An event is a specific action taken by a user on your site. You can still see if someone visits a page. But now you also know if they click a link, fill out a form, or even scroll to read more. This helps you understand user behavior on your site, which can help you make smart decisions about content and site design.
Theoretically, all of this additional data can help you understand site visitors and donors better. In reality, it might just be overwhelming if you’re not already a technical expert. GA4 is more technical overall, and requires more customization to be truly effective. That’s something your nonprofit may need to address.
Why Did They Change Google Analytics?
Completely overhauling a platform is a big deal and at least some customers are likely to be upset about the change. But Google had a few good reasons for introducing GA4. Those reasons include:
1. Online privacy policies
The introduction of the General Data Protection Regulations in the European Union caused a cascading change across major web service providers. Everyone wanted to meet the EU standards. Companies like Apple and Facebook altered the information they were willing to share about users, which changed the way data could be tracked.
2. Consumer behavior shifts
Throughout the 11 years since Universal Analytics was first released, the way people use the internet has changed. Although nonprofits don’t think of their stakeholders as “consumers,” Google is largely driven by commercial interests. Consumer demands for more online privacy and greater convenience drove some of the change in Analytics. In an increasingly competitive market, brands also want more control over the customer journey.
3. Advances in technology
Advances in machine learning and artificial intelligence mean that big data processors like Google can analyze information in new ways. The new GA4 integrates these technologies to provide different kinds of insights.
What This Means for Nonprofits
As the Chronicle of Philanthropy pointed out, big data can have a big impact for nonprofits. Google Analytics is one source of that data.
Google Analytics helps you take an integrated approach to marketing and stakeholder communications. It can show you how visitors interact with your website or advertisements, which can reveal their level of engagement and what matters most to them.
Your organization may be among the many that are just starting to use data to improve engagement and bring in donations, or you may already be comfortable handling big data. Either way, expect a learning curve as you start to navigate the new GA4 platform.
The good news is that migrating to GA4 is fairly easy. Google offers a guide to help you switch. By the way, if you think you might want to look back at older Analytics data at some point, now is the time to download it. There’s no telling when exactly Google will decide to get rid of that data.
How Nonprofits Can Get the Data They Need
One important thing to note is that GA4 collects a wider range of data from different sources, which takes longer to process. It may take 24 to 48 hours for all of your data from a given day to appear. So don’t be discouraged if you launch a new PSA campaign and don’t see a big spike in traffic the same day.
Know Where Visitors Come From
If you’re running a social media campaign, partner-based outreach, and an online ad, you might want to know which of those things is sending people to your website. Find this data on the User Acquisition report.
How to See User Acquisition Information
- From the Home screen, click the icon that looks like a graph, this will open the reports bar.
- Click Acquisition.
- Select Traffic Acquisition. This will show a very basic breakdown of organic, direct, paid, and referral traffic.
- Above the chart on the bottom half of the page, you’ll find a drop-down menu that allows you to refine the results. Select Session Source/Medium to the specific platforms and sites that are sending users to your page.
Find out if your pages are relevant
The old Analytics used Bounce Rates to help you know if your landing pages were relevant. You won’t find them on the new platform. Instead, we have Engagement and Retention metrics. These metrics let you know whether people are spending time on your pages and how often they come back.
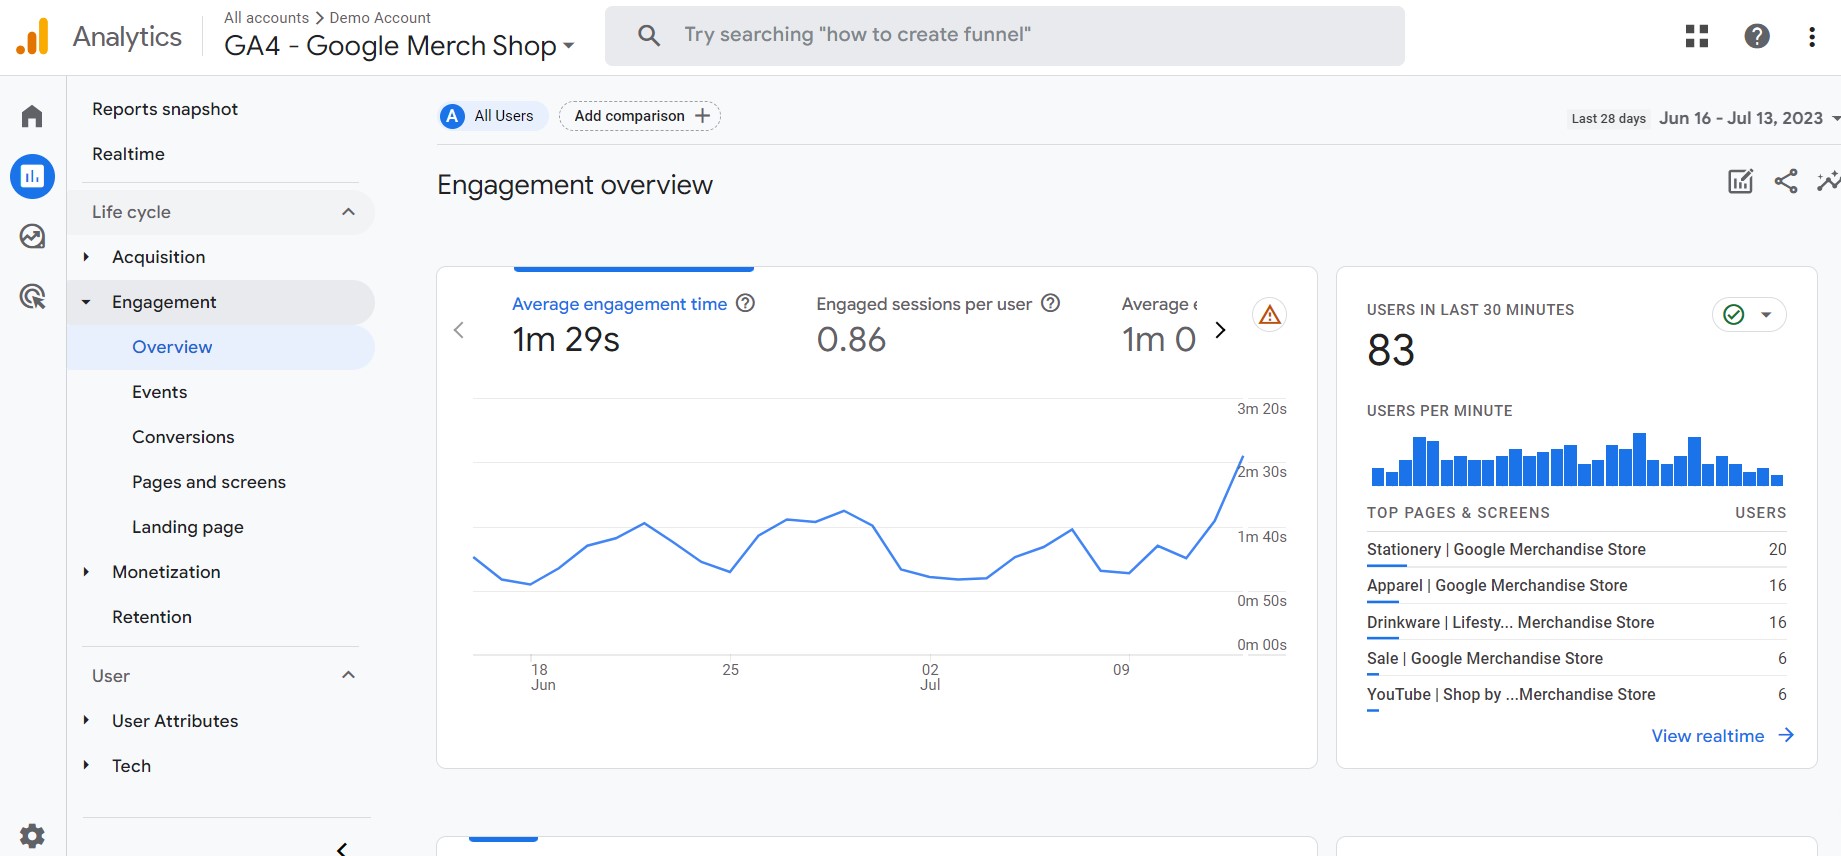
How to See Engagement Metrics
- From the Home screen, click the icon that looks like a graph, this will open the reports bar.
- Click Engagement then Overview. This will show you the average engagement time, number of overall views and events and something called “user stickiness” (more on that below).
- Click Landing Page to see where people enter your site, how long they stay on that page, and whether they’re converting.
User stickiness tells you whether the same people are engaging with your site frequently. It compares daily active users (DAU) to Monthly active users (MAU) and weekly active users (WAU). Numbers closer to 100 show that the same users are visiting your website frequently.
Set up event tracking to see what people do
This is the most valuable part of Google Analytics. It helps you track specific behaviors like clicking on a link or filling out a donation form. It also might be confusing, even if you have some technical skills.
Fortunately, Google automatically tracks several of the most common events including:
- click
- first visit
- page view
- scroll
- session start
These may be all you need to get started. If you need more customized tracking, you might want to bring in a consultant or get some hands-on training.
Alternatives to Google Analytics for Nonprofits
If all of this has you completely overwhelmed, you might be wondering if there’s something you can use instead of Google Analytics. The answer is “Yes, but…” It’s hard to beat the GA4 price tag, which is absolutely free even if your organization isn’t a nonprofit. Almost any other solution requires an investment.
- Pay for another Analytics Service like Matomo Analytics, Adobe Analytics, or Fathom Analytics. These are reputable services that promise greater digital privacy. They start at around $14 per month. You’ll need some strong technical skills to manage most of these.
- Go without Analytics. This is definitely not the preferred solution. You’ll miss out on key data that could help your organization thrive and make the most of its marketing budget.
- Use GA4 but hire a consultant. Google Analytics experts have been experimenting with the platform for months. Expect to pay upwards of $40 an hour for Google Analytics consulting.
- Use a site plug-in. If you only need basic data, you can use the free version of a plug-in like Monster Insights which links to Google Analytics. You still have to do some basic set-up, but the interface is much simpler.
- Train someone on your team using Skillshop and other resources. Skillshop is a Google-run platform that offers training in various tools owned by the company. They have a Google Analytics Certification course as well as some shorter training modules.
Tacking the results of your marketing efforts may not always be easy. The change in Google Analytics is just one example of the challenges nonprofits face in using data.
At Connect360, we may not be able to configure your GA4 dashboard, but we can help you track the progress of your Public Service Announcement campaigns. We use Nielsen tracking data and other tools to help you understand the data that is most relevant to your goals. Contact us to learn more.
About The Author

Steven Edelman
Steve Edelman is a Partner and President of Connect360. He is a leading expert on the measurement, valuation, and financial reporting of Public Service Announcements by not-for-profit organizations.
About Connect 360
Connect360 is a leading media placement agency driving measurable results for some of Charity Navigator’s highest-ranked nonprofits, well-known associations, government agencies and public relations/marketing firms.
Share This
Related Articles

Nielsen Reports Continued Strong PSA Results in 2023

Do People Still Listen to Radio?